Description
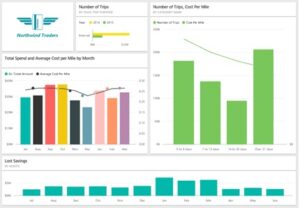
The main purpose of the course is to give students a good understanding of data analysis with Power BI. The course includes creating visualizations, the Power BI Service, and the Power BI Mobile App.
Duration: 5 Days
5 Top Takeaways from the Course
- Make your existing data work harder for you
- Integrate diverse data stores to a single data model
- Transform raw data to business intelligence
- Create rich visualisation from raw data
- Share business intelligence with colleagues
At Course Completion:
After completing this course, students will be able to:
- Perform Power BI desktop data transformation.
- Describe Power BI desktop modelling.
- Create a Power BI desktop visualization.
- Implement the Power BI service.
- Describe how to connect to Excel
- Describe how to collaborate with Power BI data.
- Connect directly to data stores.
- Describe the Power BI developer API.
- Describe the Power BI mobile app.
Audience Profile:
The course will likely be attended by SQL Server report creators who are interested in alternative methods of presenting data.
Prerequisites:
- Excellent knowledge of relational databases and reporting.
- Some basic knowledge of data warehouse schema topology (including star and snowflake schemas).
- Some exposure to basic programming constructs (such as looping and branching).
- An awareness of key business priorities such as revenue, profitability, and financial accounting is desirable.
- Familiarity with Microsoft Office applications – particularly Excel.
Topics:
Module 1: Power BI Desktop Data Transformations
This module describes how to import data into Power BI.
Lessons
- What is Power BI?
- Power BI data
- Transformations
Lab: Import Data to Power BI
- Import data to Power BI desktop
- Import data from CSV files
- Import data from a less structured file
After completing this module, students will be able to:
- Describe what Power BI is and what it does.
- Describe the types of data.
- Perform data transformations.
Module 2: Power BI Desktop Modelling
This module introduces Power BI desktop modelling.
Lessons
- Optimizing data models
- Calculations Important
- Hierarchies
Lab : Manage Power BI data
- Manage table relationships.
- Last year comparison
- Year to date Important
- Market share
- Optimize the data model
After completing this module, students will be able to:
- Optimize data models.
- Perform calculations with Power BI data.
- Describe and create hierarchies.
Module 3: Power BI Desktop Visualization
At the end of this module students will be able to create a Power BI desktop visualization.
Lessons
- Visualizing your data
- Working with multiple visualizations
Lab : Create reports with visualizations
- Cross-tabular reports
- Part-to-Whole reports
- Relationship reports
- Trend reports
- Rank reports
After completing this module, students will be able to:
- Visualize data using Power BI
- Work with multiple visualizations.
Module 4: Power BI Service
This module describes how to implement the Power BI service.
Lessons
- Working with the Power BI service
- Configuring a dashboard
- Viewing a Power BI Dashboard
Lab : Implementing the Power BI service
- Upload a Power BI report
- Share a Power BI dashboard
- Configure data refresh
After completing this module, students will be able to:
-
- Work with the Power BI service.
- Configure a Power BI dashboard.
- View a Power BI dashboard.
Module 5: Working with Excel
This module describes how to connect to Excel as a source of data.
Lessons
- Importing data from excel
- Analyzing data in Excel
Lab : Working with Excel
- Uploading an Excel file with an Excel table
- Uploading an Excel file with a data model
After completing this module, students will be able to:
- Import data from excel.
- Analyze data in Excel.
Module 6: Organization Content Packs, Security, and groups
This module describes how to collaborate with Power BI data.
Lessons
- Collaboration
- Content packs
Lab : Working with Organization Content Packs
- Create a content pack
- Edit a content pack
- Share a content pack
After completing this module, students will be able to:
- Share data for collaborative purposes.
- Create, edit, and share content packs.
Module 7: Direct Connectivity
This module describes various connectivity options using Power BI.
Lessons
- Cloud data
- Connecting to analysis services
Lab : Direct Connectivity
- Direct connectivity from Power BI desktop
- Direct connectivity from the Power BI service
After completing this module, students will be able to:
- Access data in SQL Azure.
- Connect to SQL Server Analysis Services.
Module 8: Developer API
This module describes the developer API within Power BI.
Lessons
- The developer API
- Custom visuals
Lab : Using the developer API
- Using custom visuals
After completing this module, students will be able to:
- Describe the developer API.
- Use the developer API to create custom visuals.
Module 9: Power BI mobile app
This module describes the Power BI mobile app.
Lessons
- The Power BI mobile app
- Using the Power BI mobile app
- Power BI embedded
After completing this module, students will be able to:
- Describe the Power BI mobile app.
- Download and use the Power BI mobile app.
- Describe Power BI embedded and when you would want to use it.
