In this tutorial you will learn more HTML and look at text manipulation. This will allow you to write a simple HTML site that you can then view in a web browser of your choice
About this Tutorial
Objectives
Delegates will learn to develop applications using HTML5/CSS3 and JS. After completing this course, delegates will be able to:
- Use Visual Studio 2012 effectively
- Create commercial HTML5 Web Applications
- Develop Websites that may use web sockets, animations and geolocation
Audience
This course has been designed primarily for programmers new to the .Net development platform. Delegates experience solely in Windows application development or earlier versions of HTML/CSS and JavaScript will also find the content beneficial.
Prerequisites
No previous experience in web programming is required. But any experience you do have in programming will help. Also no experience in browser IDE’s is required. But again any experience you do have with programming development environments will be a valuable.
Experience using a contemporary OO language such as C++ or C# would be useful but is not required.
Quick Access
Overview
Estimated Time – 1 Hour
Not what you are looking? Try the next tutorial – Video and Audio
Lab 1: Drawing text in a canvas
- Drawing Solid and Outline Text
- To configure the appearance of text:
// Set the font.

ctx.font = aFont;

// Set the fill style for text etc.

ctx.fillStyle = aColourOrPattern;

// Set the outline style for text etc.

ctx.strokeStyle = aColourOrPattern;
- To draw text:
// Draw solid text.

context.fillText("Some text", x, y);

// Draw outline text.

context.strokeText("Some text", x, y);
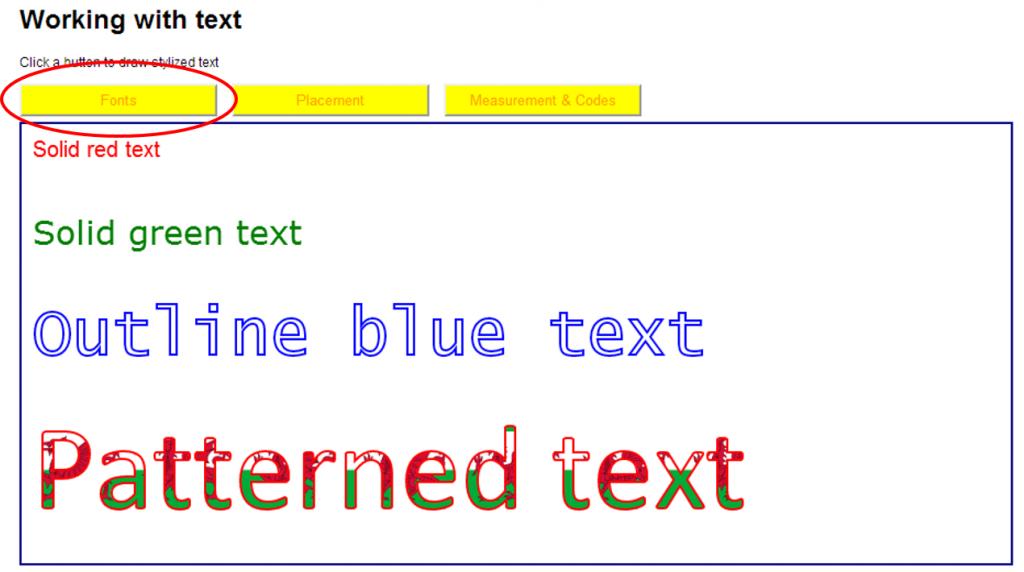
- Example of drawing text – Open Text.html , Click the Fonts button
- View code file.
- To configure the appearance of text:
- Text Placement
- To set text alignment:
ctx.textAlign = 'left' | 'center' | 'right' |

        'start' | 'end';
- To set the text baseline:
ctx.textBaseline = 'top' | 'middle' | 'bottom' |

          'hanging' | 'alphabetic' |

          'ideographic';
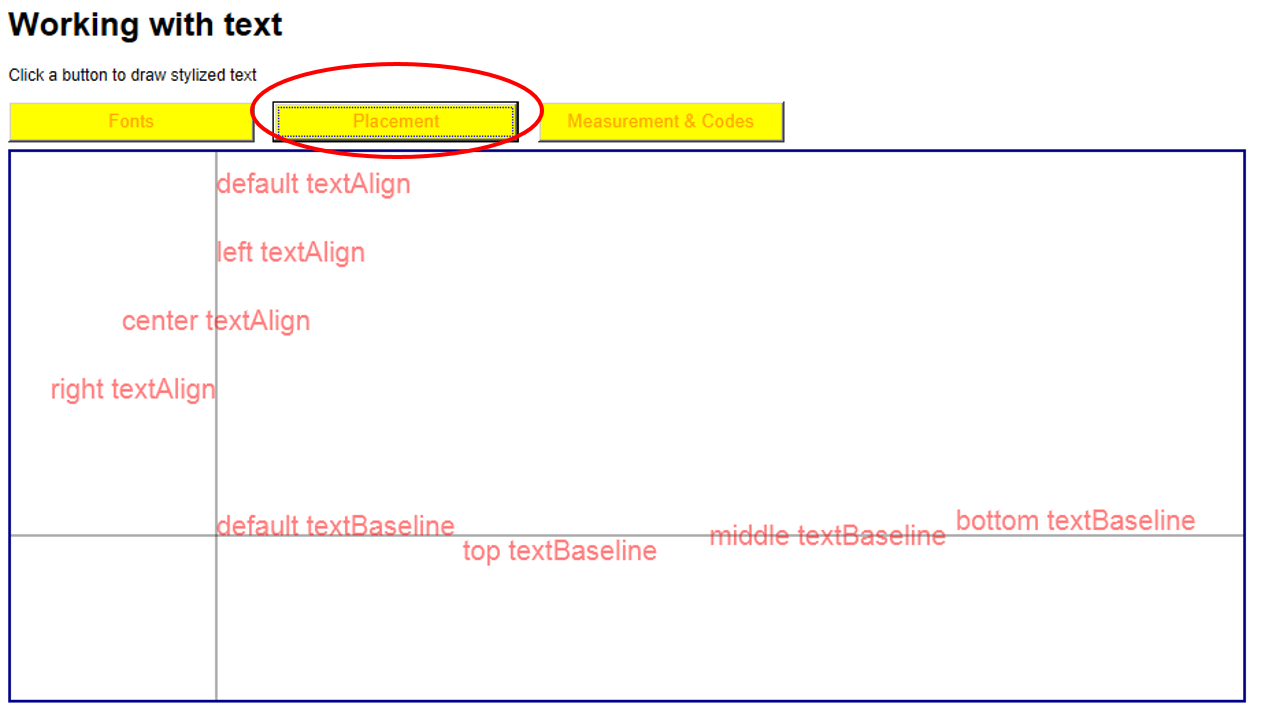
- Example of text placement – Open Text.html , Click the Placement button
- View code file.
- To set text alignment:
- Additional Techniques
- To get metrics information about some text:
var metrics = ctx.measureText(someText);

var width = metrics.width;
- To display special characters, such as :
var eacute = String.fromCharCode(0xE9);
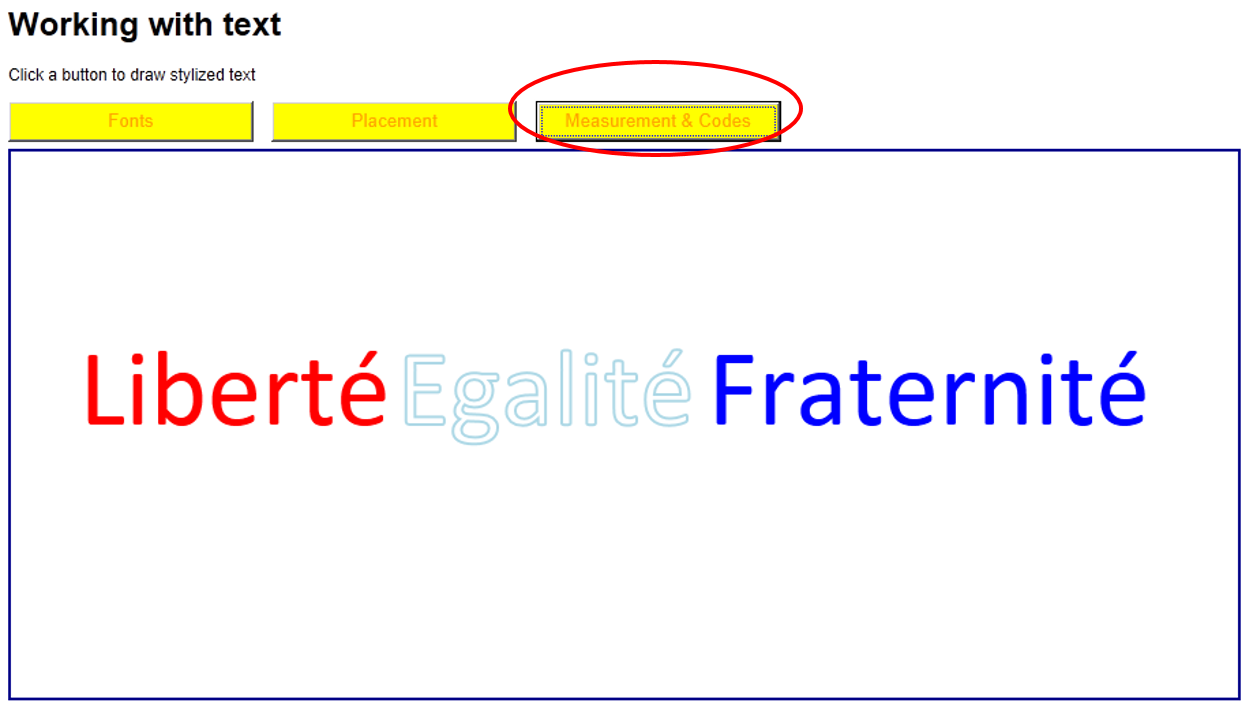
- Example of additional techniques – Open Text.html , Click the Measurement & Codes button
- View code file.
- To get metrics information about some text:
- In this lab, you’ll implement a web page that draws quadratic equations such as the following:
y = 3x^2 + 6x – 3 and All of the graphics are complete you will display the text adornments for the web page. - You will be working on the solution in the folder labelled initial and we will look at the final solution to help you understand how it works firstly
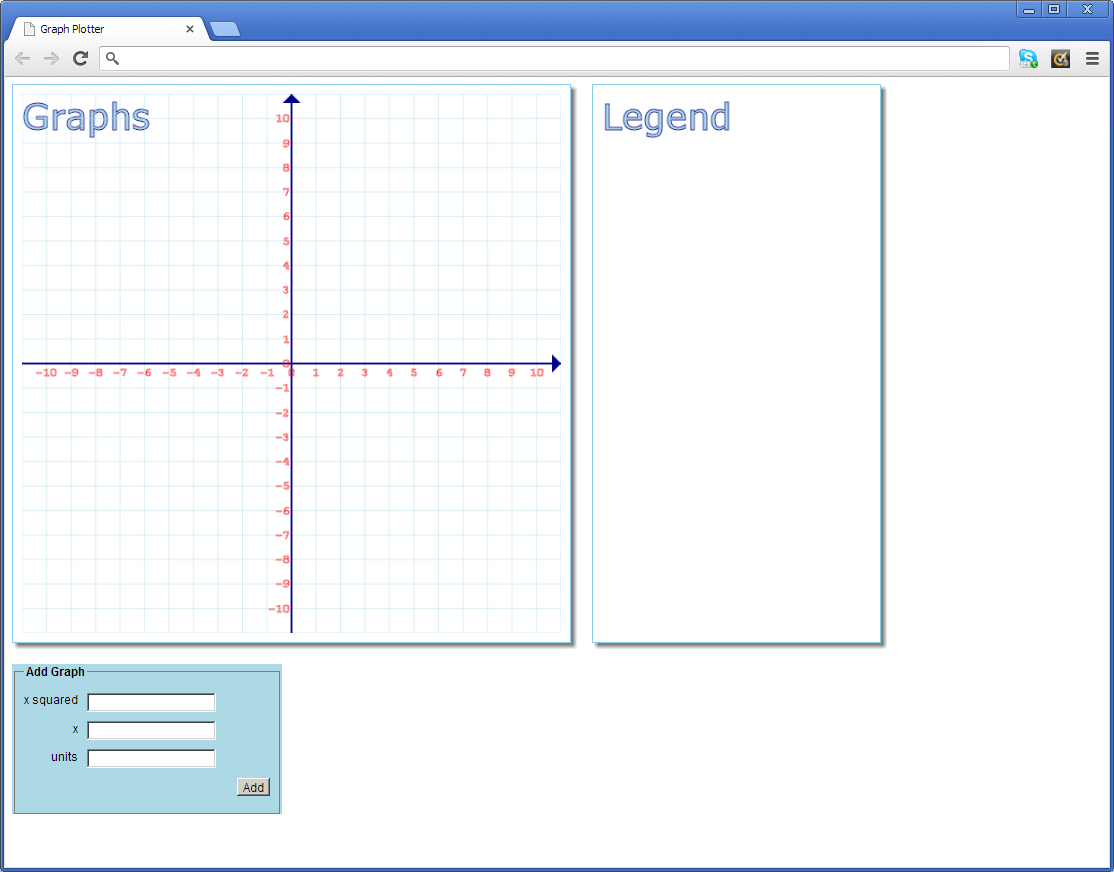
- Familiarization – Open a browser window and browse to GraphPlotter.html in the initial folder. The web page appears as follows:
- View code file.
- The web page contains two <canvas> elements and a <form> element:
- The first canvas displays graphs for quadratic equations.
- The second canvas displays the quadratic equations textually in a legend.
- The form at the bottom allows the user to add another quadratic equation.
- The form at the bottom of the web page invites you to enter the coefficients for a quadratic equation. For example, imagine you want to plot the following equation: y = 3x^2 + 6x – 3
- To plot this quadratic equation, enter the following values in the form:
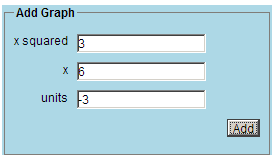
- When you click Add, the web page plots the graph in the first canvas and displays the equation textually in the second canvas:
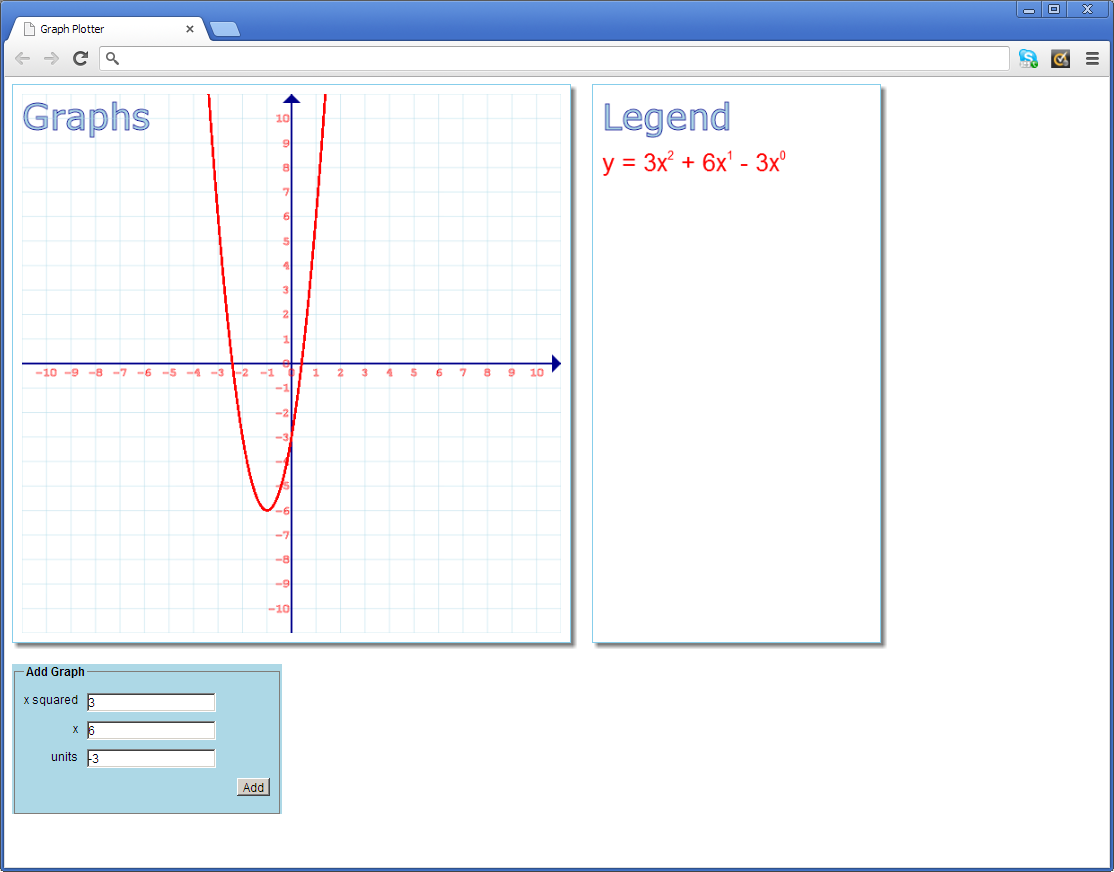
- You can add any number of quadratic equations. The first canvas plots all the equations graphically, and the second canvas shows all the equations textually. Each equation is displayed in a different colour (red, orange, gold, green, blue, indigo, and violet). If you add more than 7 equations, the colour scheme wraps around to red again.
- Open File Explorer and open GraphPlotter.html in the text editor. Notice that the web page already has two <canvas> elements named graphCanvas and legendCanvas, plus a <form> element where the user can add another graph.
- View code file.
- All the code for the web page is located in GraphPlotter.js. Open this file in the text editor and take a look at the existing code and comments. Note the following global definitions:
- View code file.
- The Graph object has properties named a, b, and c to hold the coefficients of x squared, x, and units. There’s also a colour property, so that every Graph object knows what colour to display itself.
- The CELL_SIZE variable holds the width of each cell on the grid, in pixels.
- The W and H variables hold the width and height of the graph canvas, in pixels.
- The graphs variable will hold an array of all the Graph objects.
- The legendContext and graphContext variables hold the 2d contexts for the two <canvas> elements.
- Now take a look at the following functions (all of which are complete), to get a feel for how we’ve implemented the web page. There are some interesting canvas techniques on show here:
- onLoad()
- initLegendCanvas()
- initGraphCanvas()
- drawGrid()
- drawAxes()
- onAddGraph()
- drawGraphCurve()
- xCoord() and yCoord()
- Displaying simple text
- In GraphPlotter.js, locate the drawHeaderText() function. The purpose of this function is to display a header message at the top of a canvas. Add code where indicated by the TODO 1 comment, to draw the header text with the following kind of appearance:
- View code file.
- Hints:
- Choose a big sans-serif font, e.g. 30pt Verdana.
- Set the fill style to light blue.
- Set the stroke style to dark blue.
- Set the text base line to ‘top’, and then fill/stroke the text at position 0, 0 in the specified canvas context. The ‘top’ baseline ensures that the top of the text will be anchored at this coordinate. You might like to experiment with different values for the text base line, to see the effect.
context.font = '30pt Verdana';

context.fillStyle = 'lightblue';

context.strokeStyle = 'darkblue';

context.textBaseline = 'top';

context.fillText(headerText, 0, 0);

context.strokeText(headerText, 0, 0);
- Open the initial web page in the browser. Verify the header text appears correctly in both the graph canvas and the legend canvas.
- Configuring text placement
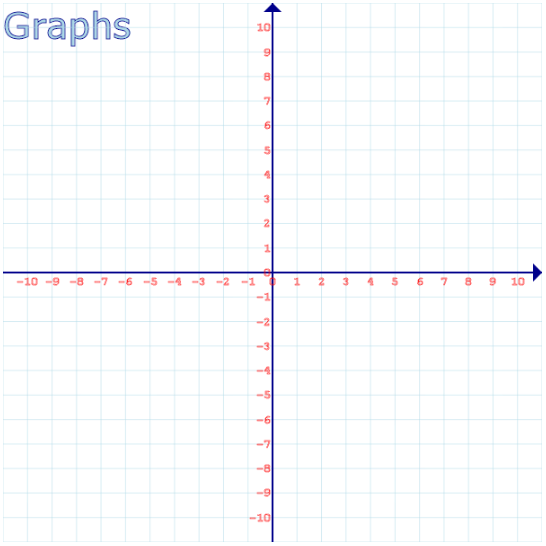
- Locate the drawLabels() function. The purpose of this function is to display the number labels on the x and y axes. Add code where indicated by the TODO 2 comment, to draw the labels as shown here:
- Hints:
- Choose a small font, set the stroke style to red, and set the line width to 0.5.
graphContext.font = '10pt "Courier New"';

graphContext.strokeStyle = 'red';

graphContext.lineWidth = 0.5;
- To draw the labels on the x axis (i.e. the horizontal axis), loop through the x values from -10 to +10 inclusive. For each value of x, call the xCoord() helper function to convert the logical x value into a pixel-based coordinate. Then display the x value as text on the canvas, just beneath the x axis (think about the text base line and the text alignment, to achieve exactly the effect shown above).
// Draw the labels on the x axis.
graphContext.textBaseline = 'top';
graphContext.textAlign = 'center'
for (var x = -10; x <= 10; x++) { graphContext.strokeText(x.toString(), xCoord(x), H / 2 + 2); } //Xcoord Function function xCoord(x) { return W / 2 + x * CELL_SIZE; } - To draw the labels on the y axis (i.e. the vertical axis), loop through the y values from -10 to +10 inclusive. For each value of y, call the yCoord() helper function to convert the logical y value into a pixel-based coordinate. Then display the y value as text on the canvas, just to the left of the y axis (think about the text base line and the text alignment again).
// Draw the labels on the y axis.

graphContext.textBaseline = 'middle';

graphContext.textAlign = 'right'

for (var y = -10; y <= 10; y++) {
 graphContext.strokeText(y.toString(), W / 2 - 2, yCoord(y));
}
//yCoord function
function yCoord(y) {
 return H / 2 - y * CELL_SIZE;
}
- Choose a small font, set the stroke style to red, and set the line width to 0.5.
- Refresh the initial web page in the browser, and verify the labels appear correctly.
- Locate the drawLabels() function. The purpose of this function is to display the number labels on the x and y axes. Add code where indicated by the TODO 2 comment, to draw the labels as shown here:
Lab 2: Web fonts
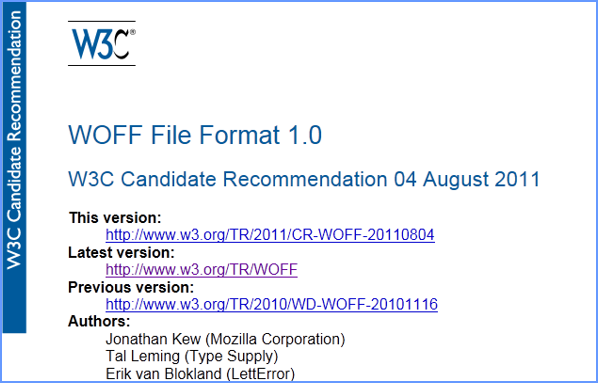
- Introduction to WOFF Files
- Obtaining WOFF Files
- You can obtain WOFF files from font foundries
- These fonts have been created by typographic companies
- Available for web use via web font services
- Most web font services require a subscription
- Some offer no-cost trials and/or no-charge plans for basic use
- Some require a one-time fee for a download
- Popular web font services:
- https://webfonts.fonts.com
- https://www.fontslive.com
- https://typekit.com
- https://www.typotheque.com/webfonts
- You can obtain WOFF files from font foundries
- Font Linking
- In CSS, use @font-face to declare and reference a web font family
@font-face {

 font-family: MyFont;

 src: url('MyFontFile.woff'),

    url('MyFontFile.ttf'),

    url('MyFontFile.eot');

}
- You can then reference the font declaration via your designated font family name - E.g. in a style sheet, in a script block, etc.
.myCssClass {

 font-family: MyFont, Arial, sans-serif;

 font-size: 14pt;  ...

}
- In CSS, use @font-face to declare and reference a web font family
- Enabling Variations of Linked Fonts
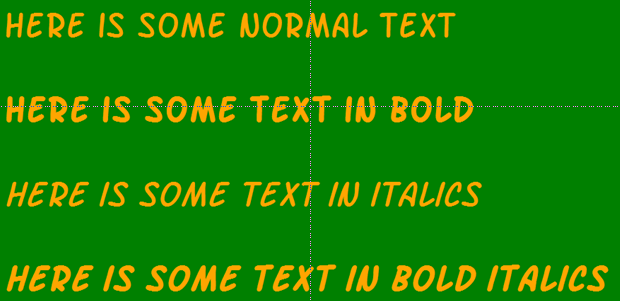
- You can declare a variation of a linked font, based on:
- Font weight (boldface)
- Font style (italics)
- Font stretch (condensed/expanded)
@font-face {

 font-family: MyFont;

 font-weight: bold;

 src: url('MyBoldFontFile.woff');

}
.myCssBoldClass {

 font-family: MyFont, Arial, sans-serif;

 font-weight: bold;

 font-size: 14pt; ...

}
- You can declare a variation of a linked font, based on:
- Example
- See UsingWebFonts.html - CSS style sheet references WOFF files (plus other font formats)
- View code file.
- Measuring text - In this exercise you'll write code to display a quadratic equation textually in the legend canvas. For example:
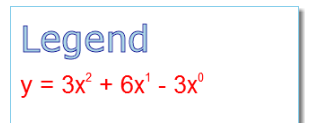
- To display an equation, you have to take the following things into consideration:
- You must split the text into several distinct parts, so that you can display the power subscripts 2, 1, 0 in a smaller font.
- You must set the text base line to 'top', to ensure the power subscripts really are displayed at the top level of the text.
- You must measure each separate part of the text, so you know where to place the next part.
- To encapsulate the task of drawing a text snippet, we've written a stub function named drawLegendTextSnippet(). Locate this function at the bottom of the file, and implement it according to the TODO 3a comments.
function drawLegendTextSnippet(x, y, fontSize, text) {

legendContext.font = fontSize + 'pt arial';

legendContext.fillText(text, x, y);

// Return the width of the text just displayed.

return legendContext.measureText(text).width;

}
- Then locate the drawGraphEquation() function. The function receives a Graph parameter, which represents the graph equation to display. For the example in the screenshot above, the Graph object would have the following properties:
- a: 3
- b: 6
- c: -3
- colour: 'red'
- Add code where indicated by the TODO 3b comment, to draw the graph equation textually as per the screenshot.
legendContext.fillStyle = graph.colour;

legendContext.textBaseline = 'top';

x += drawLegendTextSnippet(x, y, 20, 'y = ' + (graph.a > 0 ? '' : '-') + Math.abs(graph.a) + 'x');

x += drawLegendTextSnippet(x, y, 10, '2');

x += drawLegendTextSnippet(x, y, 20, (graph.b > 0 ? ' + ' : ' - ') + Math.abs(graph.b) + 'x');

x += drawLegendTextSnippet(x, y, 10, '1');

x += drawLegendTextSnippet(x, y, 20, (graph.c > 0 ? ' + ' : ' - ') + Math.abs(graph.c) + 'x');

x += drawLegendTextSnippet(x, y, 10, '0');
- Refresh the initial web page in the browser. Enter an equation and click Add. Verify the equation text is displayed correctly in the legend canvas, in red. Add another equation and verify it's displayed correctly too, in orange. What happens if you enter negative coefficients does the equation display correctly?
Well done. You have completed the tutorial in the HTML5/CSS3/JS course. The next tutorial is
10. Video and Audio
Copyright © 2016 TalkIT®



If you would like to see more content like this in the future, please fill-in our quick survey.